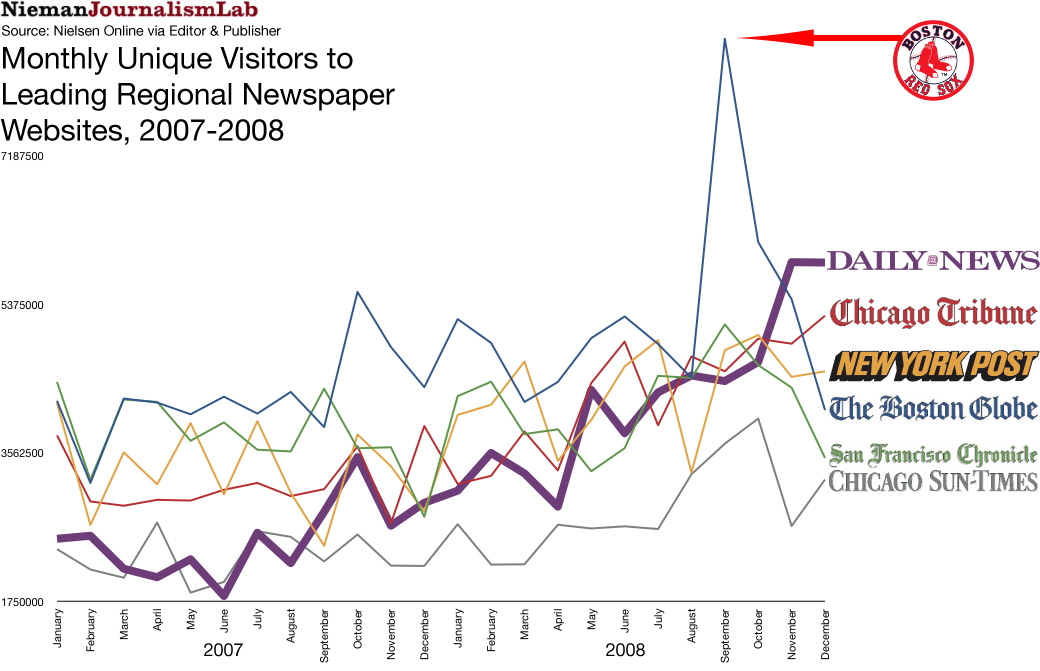
Yesterday we named the top 15 newspaper sites of 2008 (judging by average monthly unique visitors) and took a closer look at the five national papers that lead the list. In the next tier are six regional newspaper sites that showed impressive growth last year.
I’ve highlighted the most dramatic climb in the chart above: a 68-percent increase by the New York Daily News. Take that, New York Post! The Gotham tabloid war is generally measured in print circulation, but this could open up a new front, with the Post narrowly edging the News in 2008 but the momentum clearly in Mort Zuckerman‘s favor. (Note that the y-axis on this chart begins at 1,750,000 uniques.)
And what explains that dramatic but fleeting leap by The Boston Globe in September? Editor & Publisher attributed the rise to interest in the Red Sox, who narrowly made the playoffs in a tight wildcard race against the Cleveland Indians that month. (The Boston Herald had a similarly spectacular September, as did the Philadelphia Inquirer and L.A. Times, which also had teams in they playoff hunt.)
Click here for a larger version of the chart above. Below, you’ll find an interactive chart I put together with IBM’s Many Eyes that includes all nine regional newspaper sites in our ranking. (Sorry, Politico, you’re out because I couldn’t decide what you qualify as. The future, maybe.) You can click to select which newspapers you’d like to compare, and if you click through to the Many Eyes site, you can also look at relative growth.
Finally, here’s the entire dataset I’ve been working with. I compiled Nielsen Online’s metrics from Editor & Publisher’s monthly reports on the top 30 newspaper sites, including monthly uniques and time spent per visit. If a site didn’t rank in the top 30 one month, there’s no data. The 15 sites in our ranking were the only ones to make the top 30 in every month of 2008. For uniques in 2007, I extrapolated using the year-over-year increase reported by E&P in 2008. Let us know if you mine this data for any interesting results. In particular, I’ve completely ignored the time-spent metric that Nielsen believes is important but for which the data is all over the map.