
As much as things change in the news business, things also seem to stay the same. Newspaper revenue drops; smartphone usage rises.
The annual State of the News Media report from the Pew Research Center, just out today, tells that story of continuing trend lines. The top line is probably the ongoing march of mobile: As of January, a remarkable 39 of the 50 most popular news sites had more mobile than desktop visitors. Four of the top 50 had similar desktop and mobile traffic, and just seven sites had more desktop than mobile traffic, the report said, citing comScore data.
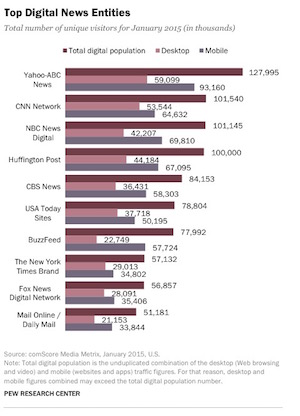 “While desktop visits are still valuable to publishers — especially when it comes to time spent on the site — the number of mobile visits now outpaces desktop visits for the majority of the top 50 sites and associated apps,” the report says. That time-on-site difference is real: Visitors to 25 of the top 50 news sites spent at least 10% more time per visit than readers coming in through mobile or apps. There were just 10 sites where mobile users spent more time per visit than their desktop counterparts.
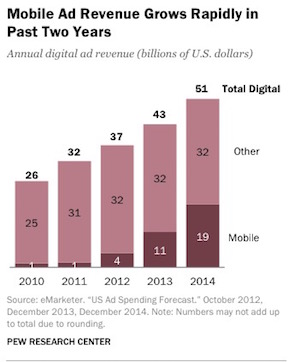 And as users migrate to mobile, advertisers are following them. $19 billion was spent on mobile advertising in 2014, a 78% increase from the $10.7 billion spent in 2013, Pew reported. (Even that large a jump represents a slowdown from the previous two years, which each had mobile growth over 170%.) Mobile ad buys accounted for 37% of all digital spending last year, up from 25% in 2013.
At 93 pages, the Pew report (like its predecessors: 2014, 2013, 2012) encompasses a ton of material and useful information, ranging from the state of cable and broadcast TV to NPR and the magazine business. If you’re interested, the entire report is worth a read, but here are a few more highlights.
Newspaper print ad revenue dropped again in 2014 to $16.4 billion, a 4% drop from 2013, the report said. Though newspaper digital ad revenue increased last year slightly — to $3.5 billion from $3.4 billion — it hasn’t been anywhere near enough to make up for the loss in print revenue.
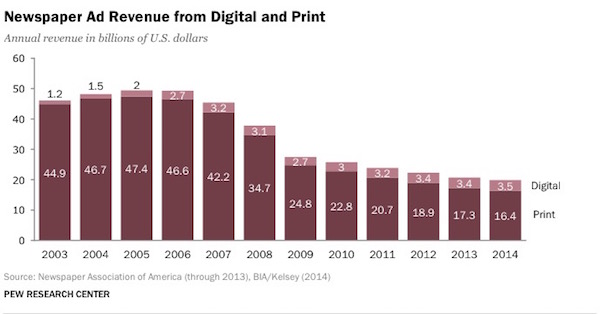
“For the past five years, newspaper ad revenue has maintained a consistent trajectory: Print ads have produced less revenue (down 5%), while digital ads have produced more revenue (up 3%) — but not enough to make up for the fall in print revenue,” the report said.
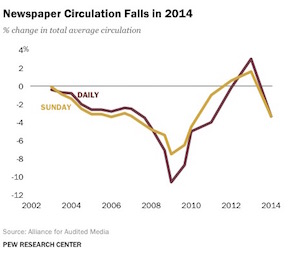
Weekday and Sunday circulation both fell last year; according to a Pew analysis of Association for Audited Media data, daily circulation fell 3.3% and Sunday circulation dropped 3.4%.
 Newspaper consumption habits also remained fairly stable, with 56% of newspaper readers exclusively reading in print.
Newsroom employment also fell (3%) in 2013, the most recent year for which data was available, though the decrease was smaller than in previous years (6% in 2012). Total newsroom employment is about 36,700, and the percentage of women and minority journalists in newsrooms remained basically flat.

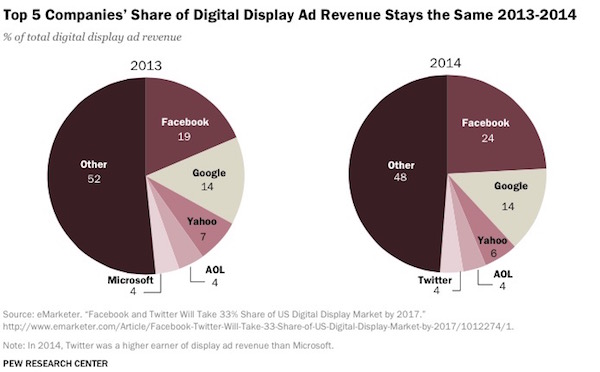
While the total amount spent on digital advertising in 2014 climbed 18% to $50.7 billion, five large Internet companies — Facebook, Google, Yahoo, AOL, and Twitter — still dominate the market.
Those five companies account for about half of all online display ad revenue, Pew found. In 2014, $22.2 billion was spent on display ads, and $11.2 billion went to those companies. Similarly, Facebook grew its share of the display ad pie as it now receives 24% of digital display ad revenue, an increase from 19% in 2013, when it overtook Google as the largest player in the display ad market.
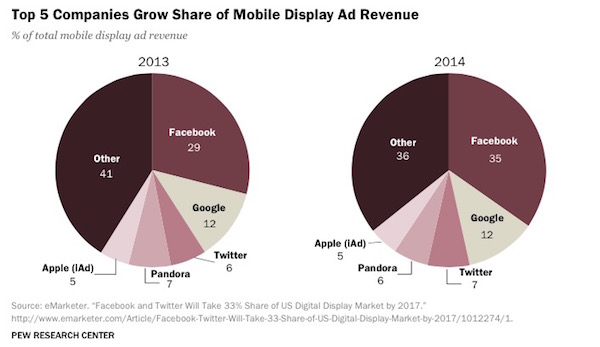
On mobile, 64% of display ads come from five companies — Facebook, Google, Twitter, Pandora, and Apple. They brought in $6.4 billion out of the $9.6 billion total spent. More than a third of all mobile display ad spending also goes toward Facebook. Facebook brought in $3.5 billion in mobile display revenue in 2014, a 131% increase from 2013.
Podcasting was seemingly everywhere in 2014, as Serial became a surprise hit. But the Pew study found that podcast listenership had been growing for years even before Serial.
“Advances in technology — in particular, the rapid growth in use of smartphones and mobile devices in addition to the increased ease of in-car listening — have contributed to the uptick of interest in podcasts,” the report says.
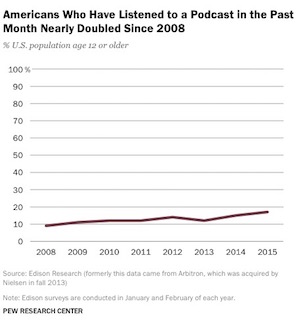 In January, 17% of Americans said they had listened to a podcast in the past month — a slight increase from 15% in 2014, but significant growth from the 9% of Americans who said they’d listened to a podcast in 2008.
Citing data from the podcast hosting service Libsyn, Pew also reported that there were 22,000 podcasts hosted on the Libsyn and 2.6 billion podcast download requests — 63% of which were requested via mobile devices.
Beyond podcasting, 2014 also saw growth in Internet radio. Monthly online radio listenership has doubled since 2010, with 53% of Americans over 12 saying they’d listened to online radio in the past month, according to data from Edison Research cited by Pew.

More people are also listening to online radio in their cars through their mobile phones: 35% of American adults have done so, an increase from 21% in 2013.
While cable news audiences continued to get smaller, national and local broadcast news organizations saw increases in viewership.

 Together, ABC, CBS, and NBC saw average viewership for their evening news programs grow 5% in 2014. They have combined average viewership of 23.7 million. Morning newscasts saw audience growth of about 2% to about 14 million on average, the report said.
In terms of local TV, viewership increased slightly in both the morning and evening broadcasts. Morning broadcasts increased 2% and evening broadcasts were up 3%. Late night broadcasts, however, fell 1%.
Surprisingly, the largest growth area for local TV news was early morning broadcasts. The audience watching newscasts that start at 4:30 a.m. grew by 6%, the study said.