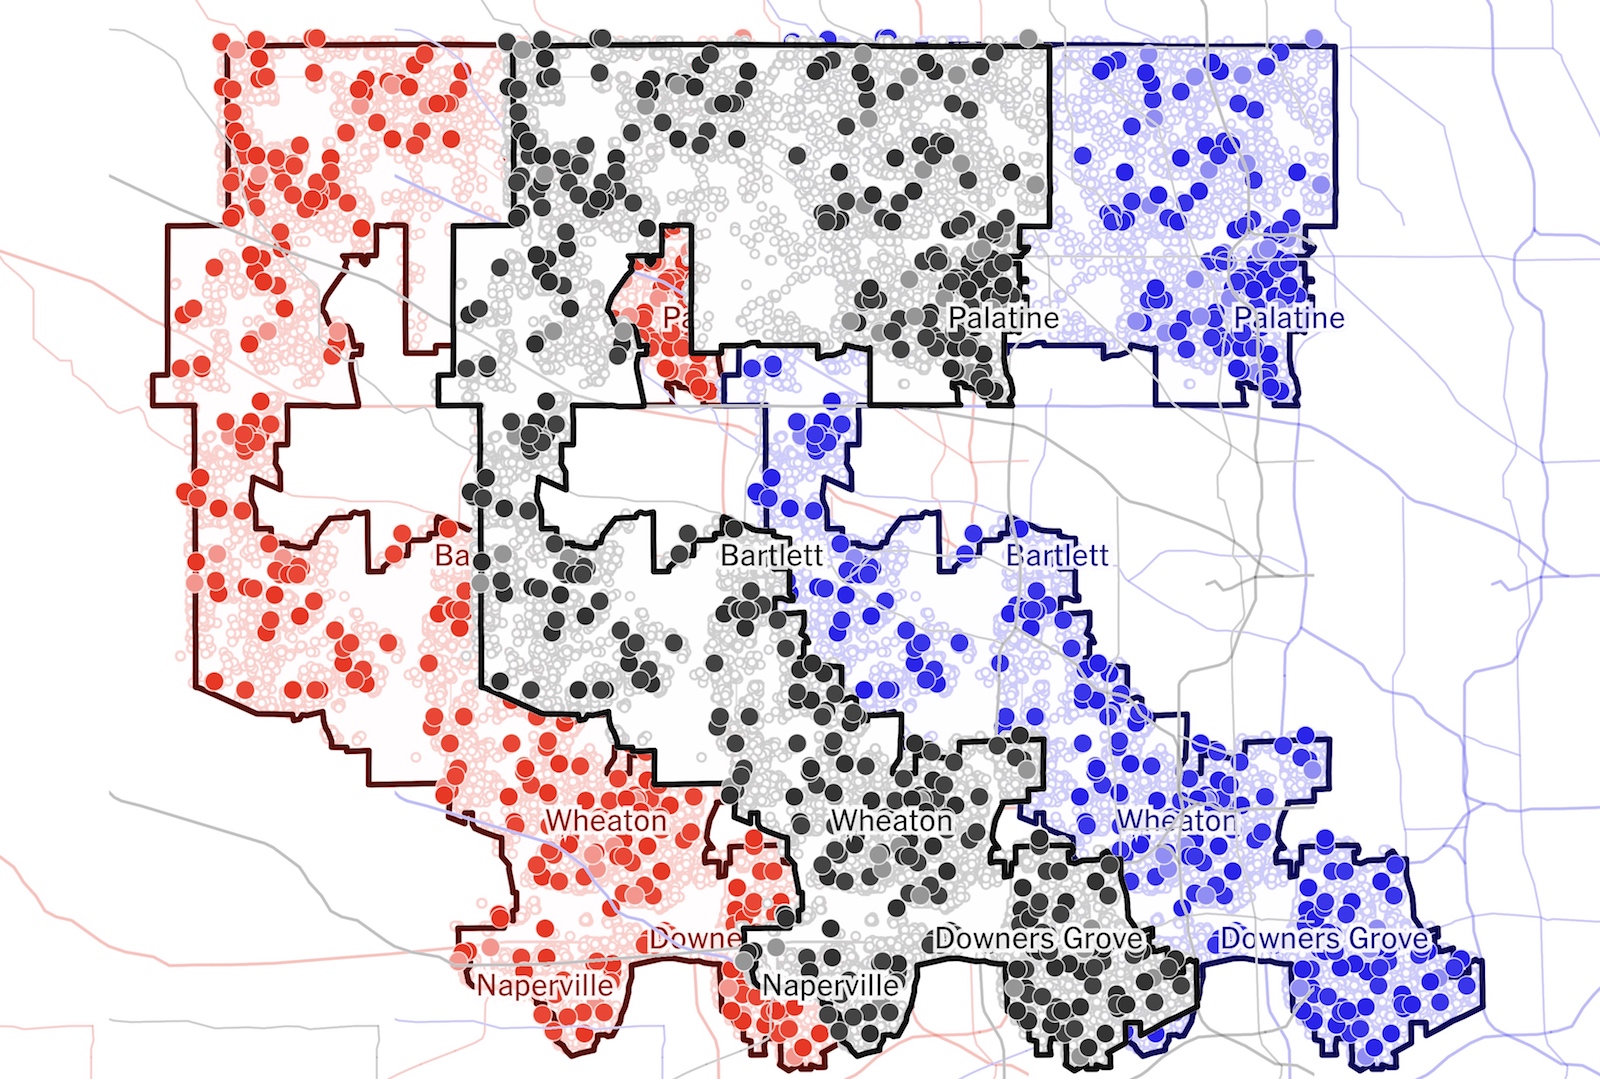
You may have heard there are some important elections coming up in the United States — ones that might have an impact on how some minor governance issues we’ve been having could play out.
The return of big elections means the return of large-scale election polling, and if you were alive in 2016, you may recall that that doesn’t always go well. Individual polls have long been subject to critique, but it was the burgeoning group of polling aggregators who seemed to get the most blowback — not least because their methods were, despite the best efforts of data journalists and others, necessarily opaque.
One study, by Sean J. Westwood, Solomon Messing, and Yphtach Lelkes, found that news audiences have a lot of trouble understanding the difference between a traditional poll result (for example, “Smith 51%, Jones 43%, with 8% undecided”) with an analytic, aggregation-driven result (“Smith has a 79% chance of winning, Jones, 21%”). The paper found that “win-probabilities convey substantially more confidence that she will win compared to vote share estimates” — to the extent that they can encourage people to not vote because they overestimate how certain the result is.
Basically, the arts of polling analysis and presentation appear to be advancing at a different rate than citizens’ capacity to understand them.
That’s all context for this interesting announcement from The New York Times about a radical shift in how the paper will present its polling work to readers. Rather than the traditional model — a poll is conducted, analysis is done, results are reported — the Times will be showing the results of its polls in real time, phone call by phone call. Here’s the Times’ Nate Cohn:
For the first time, we’ll publish our poll results and display them in real time, from start to finish, respondent by respondent. No media organization has ever tried something like this, and we hope to set a new standard of transparency. You’ll see the poll results at the same time we do. You’ll see our exact assumptions about who will turn out, where we’re calling and whether someone is picking up. You’ll see what the results might have been had we made different choices…
Night after night, we’ll give readers an engaging way to learn about candidates and districts. It will be a window into the rest of our coverage from dozens of reporters covering races across the country.
In the process, we hope to give you a sense of what polling is really about: talking to real people, one by one, in every corner of a district.
In the past, The Upshot focused on synthesizing the flood of seemingly contradictory pre-election polls into a single probability of victory. This time, we want to demystify polling.
We expect to call at least one million Americans over the next two months, but as with most polls, the vast majority of people will decline to take the surveys. Most won’t pick up the phone at all. We’ll show you what pollsters do to try to overcome problems like these and the effects of what they do.As the data arrives in real time, you’ll learn what the so-called margin of error means in a more visceral way than “±4%” can ever convey. And yet, despite it all, we think you’ll come away impressed by how often the polls still seem to end up near the truth.
Polling has limits, of course. We know many felt misled by the polls in 2016, which showed Hillary Clinton with a modest lead in the critical battleground states. But they remain the best way to measure attitudes across an extremely diverse country, even if they will never be perfectly accurate tools for predicting an election. We might not have even known the election would be close if we were left to talk to our often like-minded friends, neighbors and relatives, whether on the left or the right.
We also think this is going to be fun, and we think that’s a good thing.
(Look, we all have different definitions of “fun,” okay?)
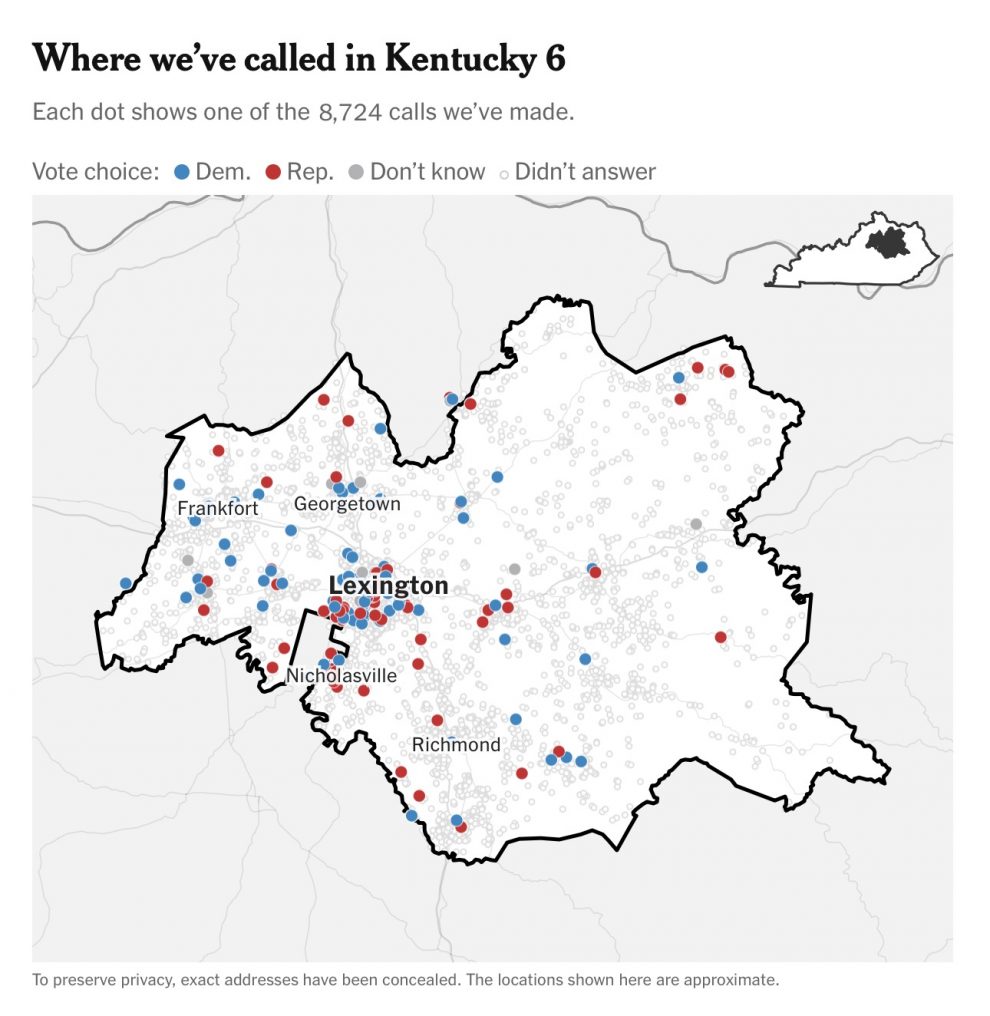
So, for instance, the Times (with its partner Siena College) is currently polling — and I mean currently — the House race in Kentucky’s 6th District. At this instant, pollsters have made 8,724 calls and actually polled 164 human beings. They’re the red, blue, and grey dots below.
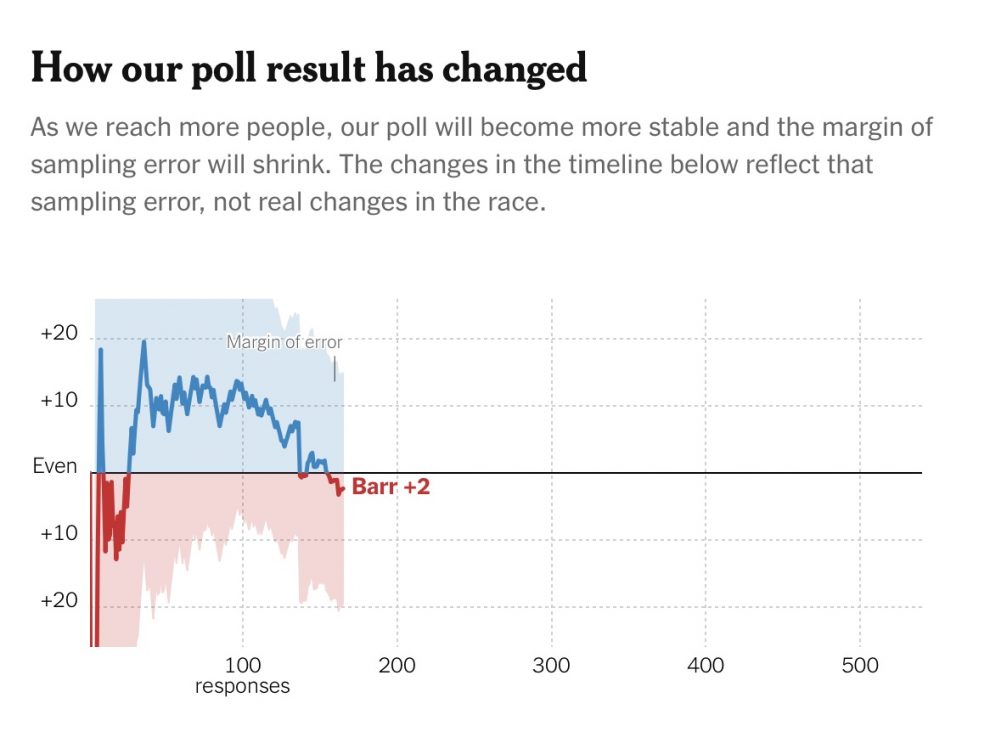
You can see how the Times’ best estimate — a two-point lead for the Republican, Andy Barr — has shifted as more calls have been answered:
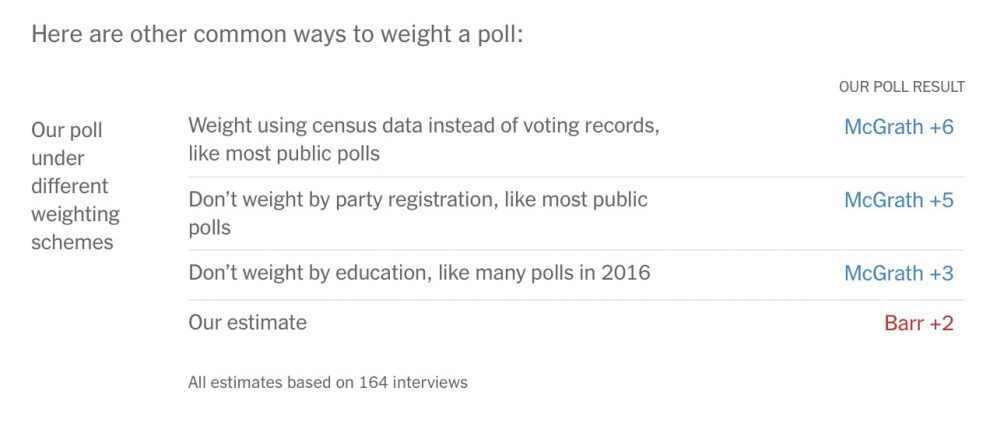
You can see how different assumptions about turnout would change the end result:

As well as different choices in weighting subgroups:
And you can see how it’s basically impossible to get young people to answer the phone:
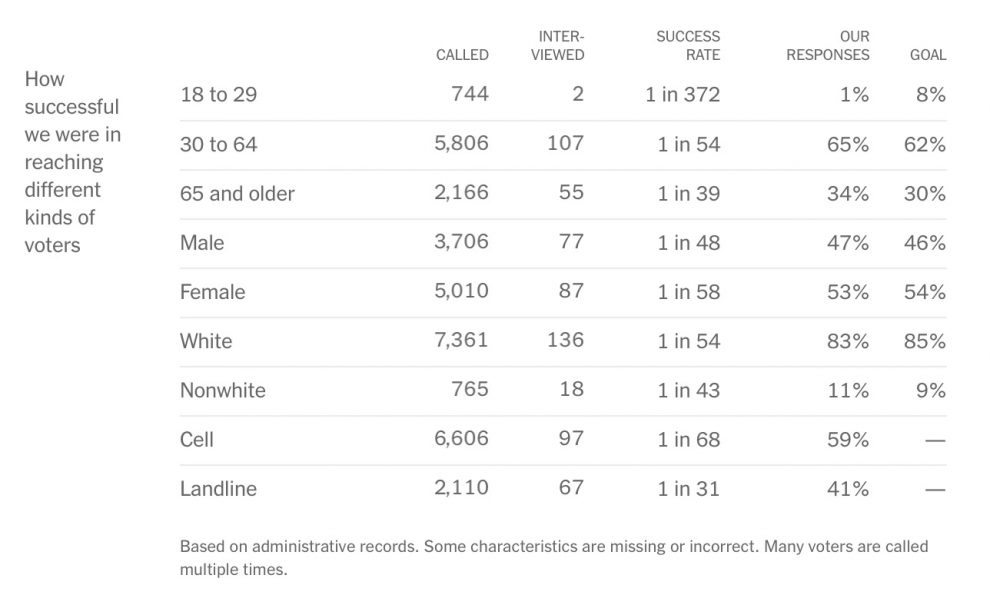
Wow. How reliable can polling of young people possibly be when 1 in 671 called answers the poll? If pollsters can somehow make it work, they're wizards. https://t.co/858hbULle9
— Sasha Samberg-Champion (@ssamcham) September 7, 2018
So if you’re interested in the KY-06 House race, this live view into NYT Polling HQ tells you…what exactly? Different and seemingly reasonable assumptions can easily swing a poll result 10 points? Polling is a box of chocolates? lol nothing matters?
If, as Cohn says, one goal is to convey any poll’s uncertainty “in a more visceral way than ‘±4%’ can,” consider that accomplished.
At the moment, we have Roskam+1, 45-44 w/ rounded figures.
When I left work, it was Casten+1 by rounded figures
a) It was even the whole time.
b) If this were the final poll, imagine how differently you'd react to…just a few interviews and rounding pic.twitter.com/9uKTH7hL3M— Nate Cohn (@Nate_Cohn) September 7, 2018
And, similarly, this poll didn't go from being "good" or "bad" to right or wrong over the last 15 interviews or whatever, depending on which side ultimately won this thing
— Nate Cohn (@Nate_Cohn) September 7, 2018
And as a raw show of institutional data journalism force, it’s pretty much unmatched. But some folks think exposing this sort of uncooked data doesn’t serve the public interest:
I ❤️ @Nate_Cohn @UpshotNYT but publishing polls b4 they’re done is IMHO foolish & borders on unethical
It’s saying “we’ll purposely inject info into the public square that could impact elections even tho we have no reason to believe it’s accurate”
— Mark Mellman (@MarkMellman) September 7, 2018
pollster twitter is (RIGHTLY) freaking out about this. don't. look. at. partials. https://t.co/up48kagYoK
— Jessica Reis (@jess4twins) September 6, 2018
Live, my eye. The comments show readers think @nytimes is interviewing people. Aren’t these polling robocalls? This is a gimmick that invites gaming and will obscure serious, nuanced reporting. @Nate_Cohn https://t.co/09xK6L1gbN
— Nina Bernstein (@NinaBernstein1) September 7, 2018
"Live polling" by @nytimes is engaging, but appropriate data analysis, reflecting the dependence structure, is much harder. Has NYT built stat'l models to get uncertainty right? What's their evidence that their specific approach works, or are they merely making bad polling worse?
— Gary King (@kinggary) September 7, 2018
weighting is good but totally insufficient. how does @nytimes deal with the time series dependence structure that is induced by later respondents knowing how earlier respondents answered the question? Doing this right is much more involved weighting
— Gary King (@kinggary) September 7, 2018
Others worry that showing how the polling sausage gets made could make it easier for the post-truthiest among us to lose faith in their results:
2, for anyone who is skeptical about pollsters just making stuff up, this MIGHT engender trust. Or it might just widen the conspiracy ("that's easy to fake!").
— Hugh Stimson (@hughstimson) September 7, 2018
3, it's sad that the NYT feels the need to go to these lengths to demonstrate transparency (if that is indeed one of their motivations, not just because-its-cool).
— Hugh Stimson (@hughstimson) September 7, 2018
5, we're super obssessed with horse-race who's-ahead politics hey? Like now we're peeping individual poll responses before they're aggregated and weighted? Yikes.
— Hugh Stimson (@hughstimson) September 7, 2018
Others think it’s just a perpetual anxiety machine, an illusion of precision for nervous partisans:
In case watching a needle jump around for a few hours on election night left you thinking "if only I could feel this sense of excitement/dread during every minute of the campaign." https://t.co/ZvPWnARK8T
— Brian Schaffner (@b_schaffner) September 6, 2018
When Nate told me about this a couple of months ago I thought he was joking.
— Brian Schaffner (@b_schaffner) September 7, 2018
Oh good, and even more efficient way to feed my anxiety. pic.twitter.com/kJC06snavv
— Kristin H Rosengren (@RosenKris) September 7, 2018
And, though I’m mostly quoting critics above, plenty of people think it’s great:
Love this sentence: "In the process, we hope to give you a sense of what polling is really about: talking to real people, one by one, in every corner of a district."
Public opinion = devoting resources to hearing what everyday Americans have to say.https://t.co/Lp6lTJDhrt
— Ariel Edwards-Levy (@aedwardslevy) September 6, 2018
Live battleground polling of the key races for House control? More of this please. Popcorn and polling- a match like peanut butter and jelly. https://t.co/exNJcSYjbs
— Douglas Herman (@douglasjherman) September 6, 2018
Really exciting work by @Nate_Cohn @UpshotNYT Methods for their polling https://t.co/k0xdsoOT0m Results https://t.co/1twjMbz3Ty this is going to be fun/interesting/meaningful to watch.
— David Rothschild (@DavMicRot) September 7, 2018
I loved this. Radical transparency in social science for the win. Bravo @nytgraphics @UpshotNYT and @Nate_Cohn
— Jonathan Robinson (@jon_m_rob) September 7, 2018
But what’s the benefit to the end user, the reader? It’s safe to assume the median New York Times reader is better informed on the exigencies of poll interpretation than most. But remember, a whole bunch of people struggle to tell the difference between “Smith has a 92% chance of victory” and “Smith will get 92% of the vote.”
Not to mention that, for the three House races where live polling has concluded — each of them viewed as a tossup beforehand — the Times’ final results showed…three tossups.
The completed NYTUpshot/Siena polls:
IL-6: Roskam (R) 45%, Casten (D) 44%
IL-12: Bost (R) 44%, Kelly 43% (D)
CA-48: Rouda (D) 45%, Rohrabacher (R) 45%All are tossups, which sounds about right https://t.co/2twEcRST2P
— Mark Murray (@mmurraypolitics) September 7, 2018
That’s a long and winding path to the conventional wisdom!
Not to mention that if you’re a poll aggregator like FiveThirtyEight, you apply weighting on top of an individual poll’s outputs — which in this case can actually change who gets viewed as the “real” leader.
Interesting factoid on the NYTimes/Sienna/@Nate_Cohn live polling project: @FiveThirtyEight is adjusting the results D+1.8 for house effects in their house model, so IL-6 and IL-12 from R+1 to D+0.8, and CA-48 from EVEN to D+1.8https://t.co/l9h1yzVPbn
— Brent Benson (@bwbensonjr) September 7, 2018
Personally, I find this stuff fascinating, I don’t put any particular emotional weight on a 1-point lead in one direction or another, and I applaud the Times for putting this much work into exposing the inner workings of what typically gets reduced to a plus sign and a positive integer.
But I do wonder if the laudable “transparency” at work here will have any of the intended impact. As I wrote about yesterday in describing a paper from Sweden, it’s unclear that audiences view transparency as anything like the trust salve that many journalists do. From that paper, by Michael Karlsson and Christer Clerwall:This study enriches current knowledge by using data from an experiment, survey and focus groups in Sweden collected between 2013 and 2015. Overall, the results suggest that the respondents are not particularly moved by transparency in any form; it does not produce much effect in the experiments and is not brought up in the focus groups…
Transparency has been heralded as an instrument which allows journalists to be more accountable to the public, which potentially increases trust and credibility. Hence, many journalists and researchers consider that transparency can change journalism to better fulfill its role in society vis-à-vis the public…
The overall impression from the three [research] methods is that transparency is a nonissue for most people…when the respondents had the opportunity to talk about journalism — i.e. what makes journalism good and credible, and what guides their own news consumption from their perspectives and concerns — transparency was not on the agenda…The respondents did not seem to have any developed ideas or great concerns about transparency.
It’s also easy to imagine scenarios in which journalistic transparency gets turned into a weapon against quality work. Consider:
Pro-transparency view: Reporters, like all human beings, have political thoughts. It’s absurd to pretend they don’t. So they should be open about things like who they vote for. Let the audience know where you’re coming from and they’ll trust you more.
Potential audience response: WHY SHOULD I TRUST ANYTHING THIS REPORTER SAYS WHEN I KNOW SHE VOTED FOR [CANDIDATE I HATE]
Pro-transparency view: Reporters necessarily select only a few quotes out of their interviews with sources to include in their stories. Some people worry that that selection process is a place where bias could slip in. So reporters should just post recordings or full transcripts of their interviews online for anyone interested to see.
Potential audience response: OMG YOU SOUND SO CHUMMY WITH [CANDIDATE I HATE’S STAFFER] AND YOU LEFT OUT THIS SMART THING [CANDIDATE I LIKE] SAID U R BIAS
Pro-transparency view: Public opinion polling is a sophisticated science, and a lot of important work goes into the translation of raw data into a set of results worthy of public confidence. At the same time, there are important questions about how best to communicate the reality that any specific result is simply the center point of a range of potential outcomes. By showing our work — even showing granular data live, as it comes in — we can build understanding and trust.
Potential audience response: Y U CHANGED THE WEIGHTING MY GUY WAS WINNING HOW MUCH DID SOROS PAY YOU FAKE NEWS FAKE NEWS FAKE NEWS
Caricatures, obviously — but it’s also easy to imagine someone seeing those wild swings in KY-06 real-time results and using them as an excuse to ignore or denigrate a poll result they disagree with. But that’s the tradeoff inherent in any move toward transparency. I’m glad the Times is providing a new set of data points on the pros and cons of such a shift — and we’ll all get to watch it roll out live.