“The actual exposure of citizens to pollutants is not very well-known, because data is not easily available or accessible to them,” said Piyush Aggarwal, a news apps developer at the Indian English-language news organization Hindustan Times. “It’s not being collected at a very large scale in a way that can be easily understood. We realized we could make something that would make relevant data available to citizens, to our readers, so that they can know what kind of air they’re breathing where they live and where they work.”
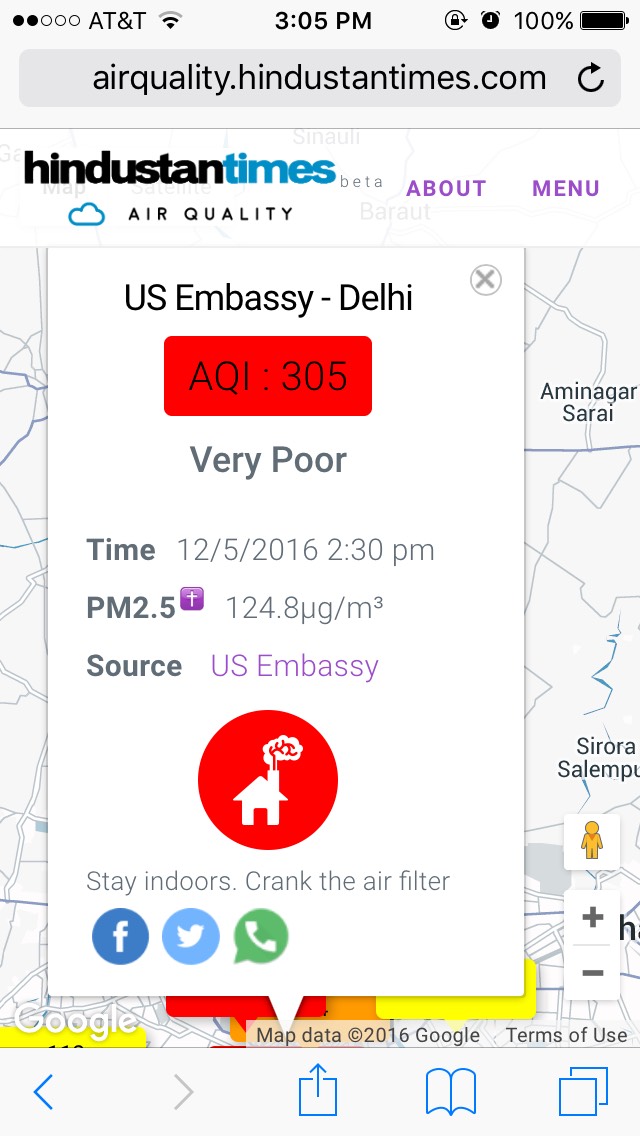
 Last month, The Hindustan Times launched, in beta, a real-time air quality map. Designed with mobile audiences in mind, it offers important data points on air pollution in cities across India. Select a city from a dropdown menu, and the app shows a map of the area with color-coded Air Quality Index labels. Users can click on the AQI label to see a card with additional data: the date and time, the specific pollutant used to calculate the AQI (e.g., carbon monoxide), relative humidity, temperature, a graph of AQI over the last seven days at that location, and measurements of two types of air pollutants PM2.5 and PM10 (these particulates are major components of air pollution but invisible to the naked eye).
The map currently pulls in data from air quality monitoring stations managed by India’s Central Pollution Control Board, as well as from the United States embassy.
 “The government data isn’t always updated, or updated quickly, and there aren’t enough sensors to cover the whole geographic area,” said Aggarwal, who helped develop the interactive. “In order to canvas the country completely, we decided to buy air quality sensors and deploy them ourselves.”
Government sensors are “expensive, certified, and accredited.” The Hindustan Times is using “low-cost, off-the-shelf DIY” alternatives, so it’s testing and calibrating a batch of these newly deployed sensors around Delhi before adding any of that air quality data to its map. The HT is also talking to NGOs and other interested groups about partnering the project. The air quality map is the paper’s first foray into sensor journalism on such an ambitious scale. And because the map is in real-time, journalists can follow up with stories on spikes or trends in pollution levels in various locations.
Landscape-oriented interactive maps look nice on large desktop monitors but can be a pain to wrangle into mobile form.
 “We wanted to make it interactive on mobile and responsive for screens of different sizes. We wanted to do a lot of customization, as much as we could, for mobile. But what happens most of the time when you open a map on your phone? You accidentally zoom in and then zoom out, zoom in and zoom out, zoom in and zoom out,” Aggarwal said. “In addition to making this usable, the major challenge was, how could we make this actionable? When you open up the website on mobile, you should see something that prompt you to make some action.”
When users tap the AQI label in their chosen city, the information card displays the date, time, and pollutant information, and replaces the seven-day graph instead with an illustration and a recommendation for what to do. On May 12, based on air pollution data collected through the U.S. Embassy in Delhi: “Stay indoors. Crank the air filter.” On mobile, in addition to sharing the card on Facebook or Twitter, there’s also an option to share on WhatsApp.
The map is in beta at the moment, and the HT team has a number of plans for improving functionality, in addition to expanding its own on-the-ground network of air quality sensors. Once there are enough data points for cities across India, the map could get a geolocation feature, and users might be able to select specific geographic parameters to explore. The team is also considering building out a real-time widget so that users can get real-time information anytime, without having to visit the HT website.
“Moving forward, we could look into many other things. Water quality could be next, for instance,” Aggarwal said. “But right now our focus is to build something that has real-time data from as many sources as possible, so that we can empower citizens to make better decisions, and so that they can hold their government accountable.”