The Wall Street Journal ran a review of a 3D printer, the MakerBot Replicator Mini, yesterday. Nothing too unusual there, at least for 2014. But the paper went a few steps beyond the norm in presenting it.
First, it made a two-minute explainer video. De rigueur at this point.
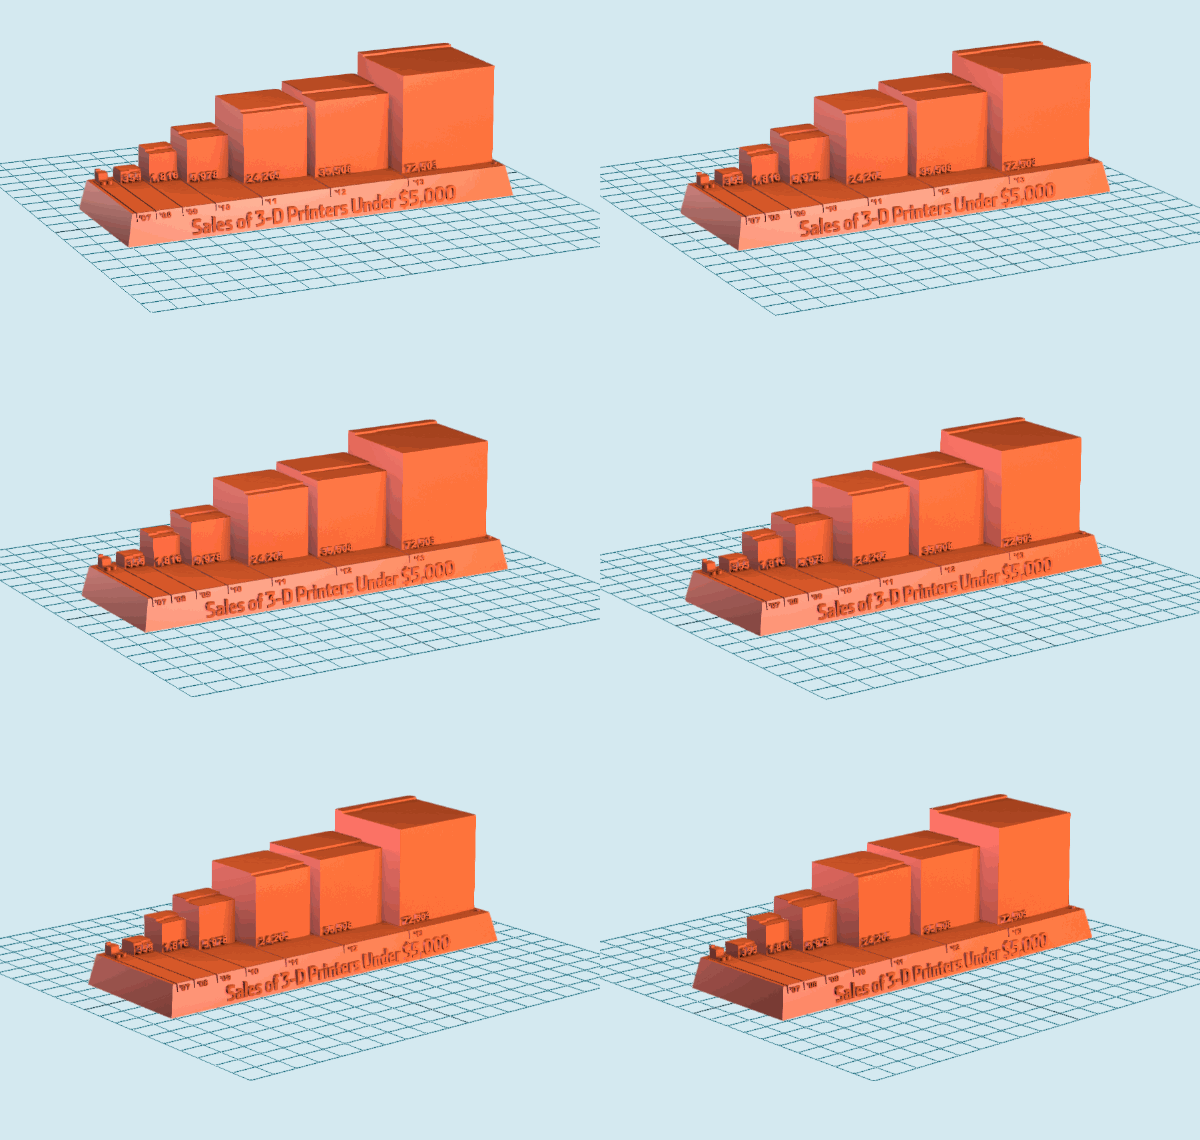
Then it used a 3D modeler to create a three-dimensional bar chart showing the growth in 3D printer sales:

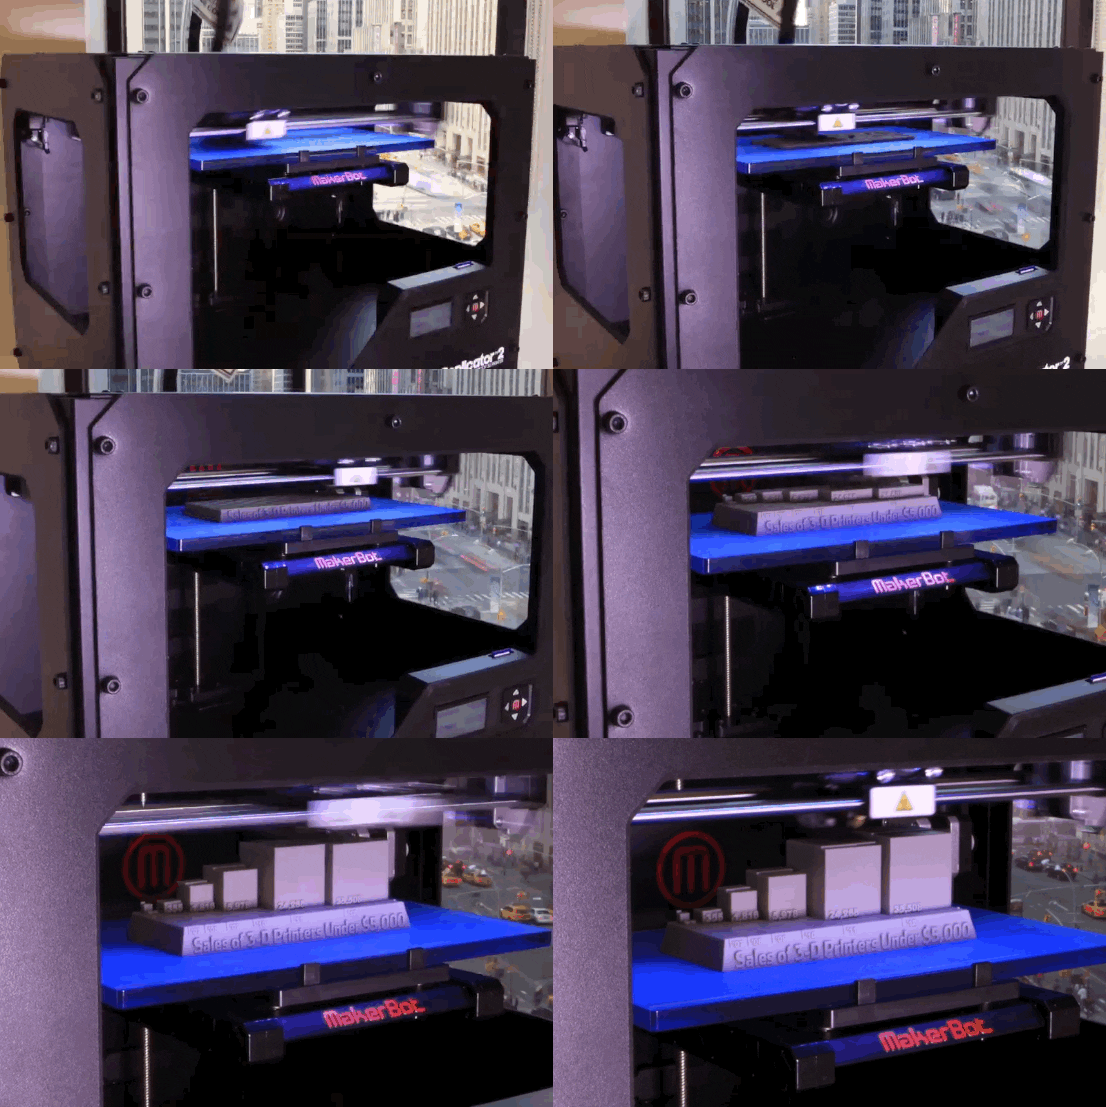
…and turned that into a set of actual physical objects with the 3D printer:

Some of the test prints of our 3-D printable chart that @RogerWallstreet designed. Final: http://t.co/7IC2aWbcJN pic.twitter.com/mYnXEo1fDy
— jonkeegan (@jonkeegan) June 17, 2014
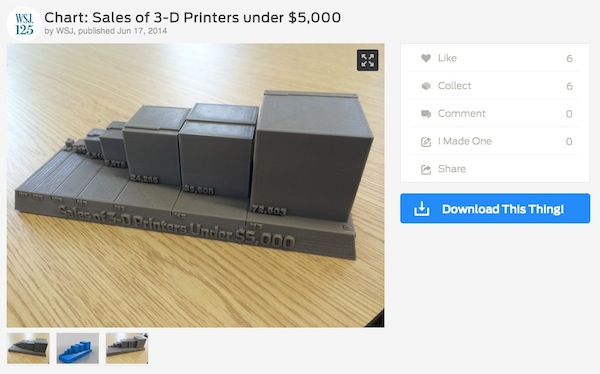
…and uploaded the model of the 3D chart to MakerBot’s Thingiverse, so others with 3D printers could download and make their own version of the physical object:

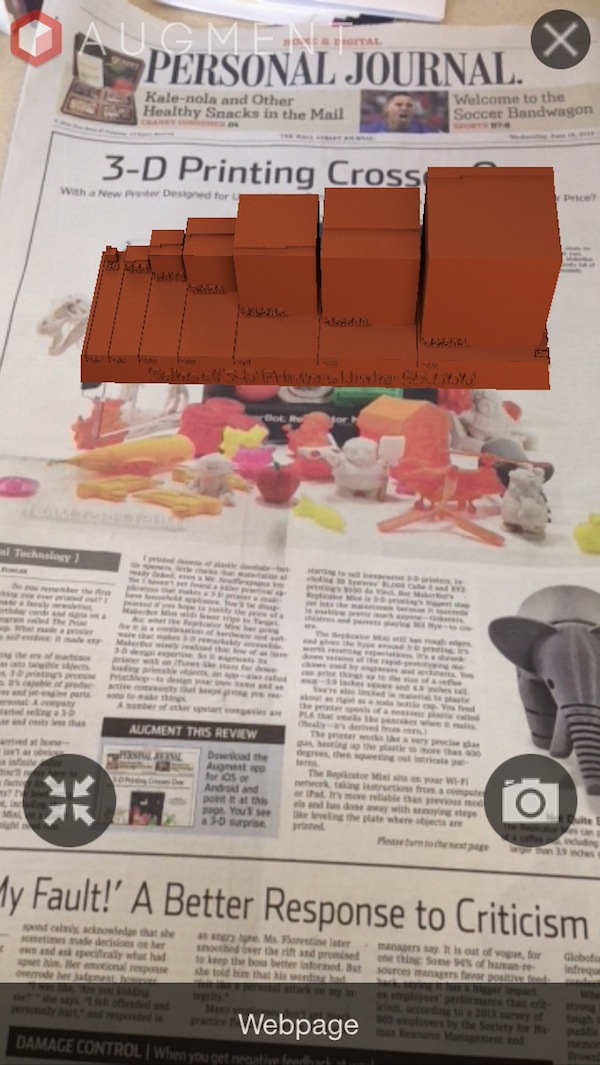
…and used the app Augment to embed an augmented-reality version of the bar chart in the print newspaper, viewable as if it were in real space through your smartphone:
Grab a copy of today's @wsj, download the Augment app (iOS/Android), point it at the Personal Journal cover. pic.twitter.com/BeI9kc9qWz
— jonkeegan (@jonkeegan) June 18, 2014
Augmented reality 3D printer chart in today's @WSJ paper. @AugmenteDev pic.twitter.com/xxHzxdIkdi
— Roger Kenny (@RogerWallstreet) June 18, 2014
(I tested it out on my iPhone — crashed the app a couple times, and took a looooong time to find the image, but it did work.)

It’s hard to file all this in any category other than “gimmick” at this point. And for all the labor that went into it, I’m sure a data-visualization critic would tell you that a simple 2D bar chart — or a half-dozen other formats — would communicate the chart’s actual information better than a News Corp Princess Leia. Still, it’s always good to see a traditional media company trying out new ways of optimizing the presentation of a story and of reaching out to new audiences.
Leave a comment